
Summary
The State of Employee Benefits 2026 examines the key cost drivers behind employer health care costs and how claims-based insights can influence employee behavior. Enrollment and claims data is analyzed to show where spending is rising and where targeted action can make the greatest impact. This blog covers health care trends from our report, including:
- Limited primary care engagement and avoidable emergency department use
- A comparison of prescription costs and medical spend for chronic conditions
- Why pharmacy costs represent the largest share of total benefits spend
The central theme of the Benefitfocus State of Employee Benefits Report 2026 demonstrates how claims-based insights can help influence behavior change to deliver measurable cost and well-being outcomes.
Our report combines enrollment and claims data to highlight three cost drivers that are impacting benefit programs. This blog covers key insights on those cost drivers and suggestions on how to manage them in your benefits program.
Three Cost Drivers of Employee Benefits
Understanding the primary cost drivers of a benefits program is a helpful first step that can help shape your cost management strategy. Here are three cost drivers that we cover in our report.
Cost Driver #1: Poor Benefits Usage
Despite the planning and effort that is involved in creating an employee benefits strategy, some employers may continue to see costs rise because of how benefits are or are not used. Employees that underutilize preventive health care in the present may inadvertently drive higher costs in the future. These findings from our report suggest that employees can be guided on how to use their benefits more effectively:
- Primary care attachment is weakening – Our data shows that 32.1% of members do not have a primary care provider (PCP), representing a 1.9% increase since 2024. While lacking a PCP does not directly drive higher costs, it may indicate limited engagement in preventive care, which can increase future reliance on specialists and late‑stage care.
- Emergency departments are replacing regular, primary care – More than half (64%) of emergency room (ER) visits were non-emergent or PCP-treatable, and approximately 75% of all ER visits were billed at higher severity levels. Treating non-urgent needs through primary care, telehealth or urgent care is generally considered a cost-effective option for members and plan sponsors.
Figure 1: 2025 Breakdown of Emergency Department Visits by Necessity and 2025 Avg. Cost of Emergency Department per Claim

Cost-savings opportunity: Employee communication and incentives can be an effective method at guiding employees to optimal benefits usage. Behavior-based incentives can help support employee engagement with specific health activities like choosing a PCP or scheduling a preventive screening. Ongoing and targeted communication can help educate employees on how to find cost-effective care.
Cost Driver #2: Chronic Conditions Management
Chronic conditions can be complex to manage and differ significantly by individual. Our data shows modest shifts in prevalence and medical spend, which may reflect broader demographic changes of younger generations making up a growing share of the workforce. Here are two findings from the report that can help inform a cost management strategy:
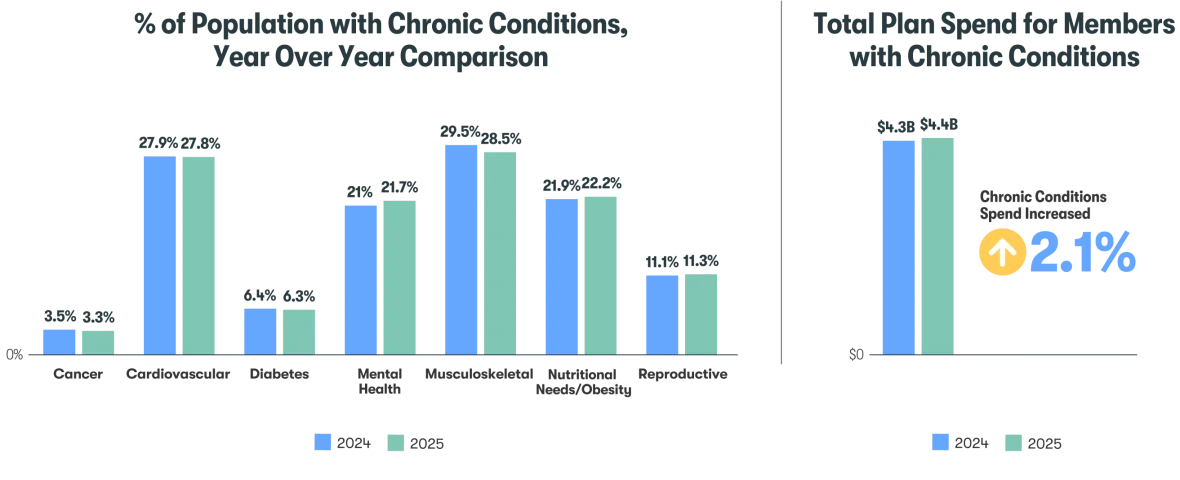
- Total spend is increasing for shrinking population – Managing chronic conditions has led to a 2.1% increase in total spend year over year (YoY), despite a slightly smaller population sample. Cancer, cardiovascular, diabetes and musculoskeletal conditions affected smaller populations, while mental health, nutritional needs/obesity and reproductive conditions had a slight increase in prevalence.
Figure 2: % of Population with Chronic Conditions, Year Over Year Comparison and Total Plan Spend for Members with Chronic Conditions
- Prescription spend is the root cause of total spend increase – Medical spend for members with chronic conditions has decreased 1.1% YoY, while prescription spend increased 10.6%. Members with chronic conditions averaged $2,191.60 in prescription costs per member per year (PMPY), compared to $437 PMPY for members without chronic conditions.
Cost-savings opportunity: Guiding employees towards high-quality, in-network health care point solutions can be an effective way to manage claim costs for chronic conditions and help balance the continued rise of prescription spend. When health care data analytics is paired with point solutions, informed employers can confidently design benefits programs that align with employee needs while driving measurable health and financial results.
Cost Driver #3: Rising Pharmacy Expenses
Prescription drug costs have become the most significant and fastest‑growing pressure point in employee benefits. This expense isn’t fueled by volume, but by a concentration of high-cost prescriptions. As this shift accelerates, employers can no longer rely on traditional cost‑containment tactics and must rethink how they manage high‑cost medications. Our data reveals these pharmacy insights that are impacting employers:
- Pharmacy requires largest portion of spending – Pharmacy costs in 2025 were the largest share of total benefits spending at 29.5%, up 2.3% YoY. The second largest share was outpatient procedures at 24.7%.
- Generic prescription availability is limited – The majority of prescription spend (51.7%) goes to brand drugs with no generic options, although these were attributed to only 12.6% of prescription orders. Specialty drugs took 35.9% of the spend and 1.4% of prescription orders.
Figure 3: Prescriptions by Drug Category, % of Overall Prescriptions and Plan Paid by Drug Category, % of Overall Spend

Cost-savings opportunity: Employers have a meaningful opportunity to reduce costs by changing how those medications are sourced, not whether they’re used. Pharmacy procurement strategies enable plan sponsors to access the same clinically appropriate medications through more cost‑effective, compliant channels, which can deliver immediate and material savings. By focusing on procurement, employers can lower overall pharmacy spend without disrupting care.
Influencing Employee Behaviors to Manage Health Care Costs
The State of Employee Benefits Report 2026 reinforces the importance of closing the gap between benefits offerings and engagement. Employers can leverage enrollment, claims and behavioral data to better understand where employees struggle and proactively guide them toward optimal decisions that are intended to improve health outcomes and reduce unnecessary costs.
Stay tuned for the full State of Employee Benefits Report 2026 and learn more insights about these cost drivers.